Discussion:
Number generator from a distribution with an specified mean and variance?
(too old to reply)
javivi
2007-03-27 12:10:10 UTC
Permalink
Hi all,
 
I would like to create a generator of numbers following a distributions with an specified mean and variance. Any of you knows how to do this?
 
Please, help me, i m quite blocked with this problem..
 
Thank you very much in advance!
 
Javi.
gwd
2007-03-28 13:40:10 UTC
Permalink
This is a problem commonly encountered when doing Monte Carlo simulations (and it sounds like this is what you are doing).

I found a discussion if this at
http://omlc.ogi.edu/news/sep98/montecarlosampling/montecarlo1.html. You
will also find it in other references dealing with Monte Carlo
simulation.
gwd
2007-03-28 16:10:07 UTC
Permalink
I just saw the previous message. Yes, you can do this the hard way.
However the integral of a Gaussian is an error function and if you
don't have the analysis vis you don't have that either. You would have
to generate a text file of samples of the error function and use that
as an approximation to the integral.

Time-consuming (although a good Labview exercise).

Another approach is to generate a large text file of random numbers
with the right distribution (say, using Matlab or other computing
software) and read them in sequentially with Labview.
javivi
2007-03-28 16:10:11 UTC
Permalink
Gererating a file with random numbers? I already have the random generator function in labview. Is not enough with it?
I'm sorry about so many messages... I am new  :-|
 
javivi
2007-03-28 15:40:09 UTC
Permalink
I have tried to look for this .vi, but i didn't find them in my computer. I guess it could be dued to the LabView version i am using is too old, v5.1, you think so? You think I could just paste the .vi in the folder of my computer? in that case, where could I find this file?
Thank you very much for your help... i'am a bit unexperienced in LabView.
Regards,
Javi.
altenbach
2007-03-28 16:40:10 UTC
Permalink
If you have a given arbitrary distribution, you can simulate matching random data by thesholding into the normalized integral of the function with a plain random number 0...1.
 
Attached is a simple example (LV 8.0). Modify as needed.
<img src="Loading Image...">
&nbsp;
&nbsp;Message Edited by altenbach on 03-28-2007 09:23 AM


DistributionSim2.vi:
http://forums.ni.com/attachments/ni/170/238316/1/DistributionSim2.vi


SimDistBD.png:
http://forums.ni.com/attachments/ni/170/238316/2/SimDistBD.png


SimDistFP.png:
http://forums.ni.com/attachments/ni/170/238316/3/SimDistFP.png
gwd
2007-03-28 18:10:07 UTC
Permalink
A truly elegant solution from altenbach. This implements the
transformation I referred to. (And quite compactly). In this case the
hard way is not so hard after all.

This shows that it's not always necessary to have the analysis vis. Of
course it's easier, possibly more accurate, and certainly faster. But
if you need to you can implement most any algorithm you can look up.
Filters, FFTs, etc. etc.
javivi
2007-04-03 15:10:10 UTC
Permalink
Hi,
Thank you for your answers, and sorry me fot not answering earlier, i was busy wiith other stuff.
Anyway, i guess i have not understood it yet. In the program you are proposing, you take a array containing the values of the probability density function, you build the 2 first graphics, but then i don't understand what you are doin later. Anyway, what I am looking for is to be able to select in the frontal pannerl the mean and variance of the distribution, so i guess this way doesn't fit my necessities.&nbsp; Any ideas?
Regarding MonteCarlo simulations, i have been reading some papers but I have not understud it pretty much.. the only idea i have is that it uses random numbers to match them with numbers from a probability distribution.&nbsp; I think it could help me a bit more, but i don't know how to use/implement it either. In my computer I have random number generator and erf function, which I guess are necesary, but i don't know how to build my generator.... please, any help is really welcome :-)
Thank you very much!!
Javi.
gwd
2007-04-03 18:40:08 UTC
Permalink
The vi posted by altenbach does exactly what you say you wanted- it
produces random numbers with a specified distribution. The distribution
is specified by the contents of the array constant at the far left.
That vi implements the equation I pointed you to. If you want a
different distribution you change the contents of the array.

The implementation is compact and efficient but it uses only basic
Labview constructs. I'm guessing here that you are not following what
Labview is doing. So you should probably spend more time getting up to
speed by doing some Labview tutorials before jumping in and working on
your ultimate objective. This may seem inefficient but in the long run
it isn't.

As I understand it your objective is to get Labview to send a
particular random distribution of packets to a network node. I don't
think you will need to go very far with reading about Monte Carlo to do
this. I think you only need the method for generating the random
distribution.
gwd
2007-04-09 19:10:07 UTC
Permalink
From left to right the array vis are:

Interpolate 1D Array


Index Array


Replace Array Subset


which are all probably found in 5.1.


I
can't open it either as I am running 7.1. And if I HAD it I could only
save for 7.0, which leaves at least two more steps of saving for
previous before it gets back to 5.1. Best is for you to try to wire it
up yourself.

If you need to open a file best to use Read From Spreadsheet File.vi
(if you have it) otherwise you will need to deal with delimiters,
string/ number conversions, etc.
javivi
2007-04-16 19:40:12 UTC
Permalink
Hi,

I guess i am a bit confused..

First of all, let's be sure that you know what i'm looking for: i want
to get values following a dessired distribution function. Is that what
your proposed algorithm makes? if so, where do we have the points?

Analizing your algorithm, this is what i guess it does: from an array
conteining the values of the probability density function, you draw it,
you build the probability distribution function, and then... i get
lost. I guess that what you are trying to do is to build a "simulated"
probability distribution function. Every time you get a number, you add
1 to the equivalent position of a 0 array, so the real probability
distribution function is suposed to be drawn. But i guess it doesn't
work (at least in my laptop with LV7.0). You can find encolosed my
suggestion to do this. Basically, for each number taken from the array
(x), I look for its equivalent position in a 0 array (500 + x*500/2 for
an array of1000 values), and I add 1 in this array. This will be the
"simulated" distribution probability function. What do you think about
it?

Another point, i would like to know&nbsp; what do you think about the way of
generating random points from a normal distribution that I'm using in
secuence 2: if i have an array of 1000 elements that i know they are
following the probability distribution, i just select one value each
iteration using the random generator. Are this values following the
same probability distribution? In case they are, it will be ok for me,
it's what i'm looking for. I know it's not necessary to say this, but
whatever your answer is, i would like you to be sure about it.

Thank you very much to all of you for your time! :-)


untitled1.JPG:
Loading Image...


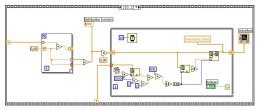
number generation.JPG:
http://forums.ni.com/attachments/ni/170/242004/2/number generation.JPG


probability density function.JPG:
http://forums.ni.com/attachments/ni/170/242004/3/probability density function.JPG
altenbach
2007-04-16 20:10:10 UTC
Permalink
Why in the world would you use a waveform chart in your code??? Only a waveform graph seems suitable for a histogram.
&nbsp;
And why are you writing to a local variable instead of the terminal inside the loop?
&nbsp;
Also: when building the distribution in frame 1, there is no reason to built an array in a shift register. Simply autoindex the scalar function value at the left loop boundary. The input&nbsp;terminals belong outside the loop because the values should not change during loop execution.
&nbsp;
Also: Your function does not give a normal distribution. The "dice" gives an even distribution between 0 and 1 and none of your scaling will change that.
altenbach
2007-04-16 20:40:09 UTC
Permalink
altenbach wrote:
..Simply autoindex the scalar function value at the left loop boundary.

Sorry, of course I meant "...at the right loop boundary"
javivi
2007-04-17 10:40:08 UTC
Permalink
Hi,Why in the world would you use a waveform chart in your code??? Only a waveform graph seems suitable for a histogram.
Just inexperience..
And why are you writing to a local variable instead of the terminal inside the loop?I am used to do it, but I know it's not necesary to do this.Also: when building the distribution in frame 1, there is no reason to built an array in a shift register. Simply autoindex the scalar function value at the left loop boundary. The input&nbsp;terminals belong outside the loop because the values should not change during loop execution.Thanks, understood.Also: Your function does not give a normal distribution. The "dice" gives an even distribution between 0 and 1 and none of your scaling will change that.Sure you are right... now i see it more clearly. Thanks!!So, now, my last doubt, i hope someone can answer me: I pick up numbers randomly from an array of values which i know they come from a probability distribution. Are these picked up values following the probability distribution too?Thank you very much for your time :-)
altenbach
2007-04-17 17:40:07 UTC
Permalink
javivi wrote:
So, now, my last doubt, i hope someone can answer me: I pick up numbers randomly from an array of values which i know they come from a probability distribution. Are these picked up values following the probability distribution too?


Only if that array is of near infinite size. In all other cases you will get a distribution from a set of finite values and thus statistically suspect. Here's an example:

<img src="Loading Image...">
Of course if you always get a new array with gaussian noise, it might be OK. In this case you might as well just get a fresh gaussian white noise array with one element each time and leave out the random indexing, right?

<img src="Loading Image...">
There is also a very simple formula to get a normal distributed random number from two even distributed random numbers, (it was actually&nbsp;used on the texas instruments programmable calculators in the seventies). Maybe I can find it somewhere. If I remember right, I implemented it in LabVIEW about 10 years ago. ;)Message Edited by altenbach on 04-17-2007 10:14 AM


GaussianRandomNumber.png:
http://forums.ni.com/attachments/ni/170/242219/1/GaussianRandomNumber.png


gaussianRandomNumber2.png:
http://forums.ni.com/attachments/ni/170/242219/2/gaussianRandomNumber2.png
altenbach
2007-04-17 18:10:12 UTC
Permalink
altenbach wrote:There is also a very simple formula to get a normal distributed random number from two even distributed random numbers, (it was actually&nbsp;used on the texas instruments programmable calculators in the seventies). Maybe I can find it somewhere. If I remember right, I implemented it in LabVIEW about 10 years ago. ;)


OK, found it! To generate a&nbsp;normal distributed random number, you can use the Box-Muller algorithm (look it up!). A simple LabVIEW implementation is shown here:

<img src="Loading Image..."> Message Edited by altenbach on 04-17-2007 10:49 AM


BoxMuller.png:
http://forums.ni.com/attachments/ni/170/242230/1/BoxMuller.png

Continue reading on narkive:
Search results for 'Number generator from a distribution with an specified mean and variance?' (Questions and Answers)
3
replies
finding normal distribution?
started 2007-04-15 04:26:50 UTC
mathematics
Loading...